Boscalia Technologies S.L., in collaboration with the Government of Extremadura (Department of Economy, Science, and Digital Agenda) and the European Regional Development Fund (ERDF), has developed the TANNIRS project.

What relationship can there be between wine, wood, and spectroscopy?
Polyphenols are molecules that are abundant in fruit and wood and are involved in various stages of wine aging. The wood of the barrels is an important source of these polyphenols. During the time that the wine is in the barrel, these compounds are released from the wood into the wine, modulating its organoleptic properties (color, aroma, and flavor). An alternative to traditional wooden barrels is the use of steel or aluminum tanks combined with oak alternatives (e.g. chips). This reduces aging times and costs associated with wooden barrels (maintenance, loss due to evaporation, etc.), as well as improves control over the levels of polyphenols that are released into the wine since excessive amounts can be counterproductive.
In recent years, the production of oak alternatives has become more sophisticated, but only French and American oak is commercially available. In Spain, we have several species of oak with the same potential. Their use would allow us to revalue the national product and make forest management and care profitable, boosting the economy in rural areas, creating jobs, and guaranteeing the sustainability of forests and their environmental value. On the other hand, their use would introduce new nuances and properties in the wine sector.
To take this step, it is necessary to provide quality guarantees. This is where Vis-NIR spectroscopy can help in the chemical characterization of woods, ensuring suitable oenological properties for wine aging. So far, the most commonly used techniques are expensive, slow, and destructive. In contrast, spectroscopy is a cheap, non-destructive, and fast technique.
OBJECTIVE
The objective of the project is to provide the wine sector with a fast and effective method based on Vis-NIR spectroscopy to guarantee the quality of forest-origin raw materials (oak alternatives and other potential species) and ensure or improve the organoleptic quality of wines. This opens up the possibility of revaluing woods present in the forests of Spain and specifically in Extremadura, as well as their byproducts without commercial use, improving their profitability and the proper management of forest spaces.
DEVELOPMENT
The samples:
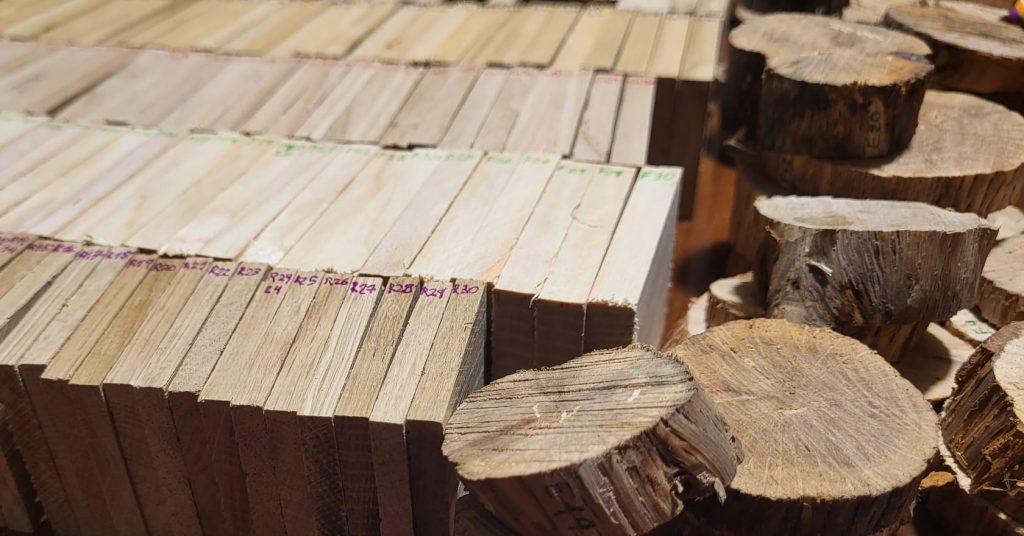
Among the different types of wood alternatives used in wine produciton, for more information consult Chatonet (2007), those in the the form of cubes or dice were chosen. The analised species were: chestnut, cherry, ash, holm oak and French oak. The wood samples were provided by Extremadura forest owners with the exception of the commercial supplier of the French oak samples. In total, 30 samples per species were analysed (n=150).
Gas Chromatography Mass Spectrometry (GC-MS).
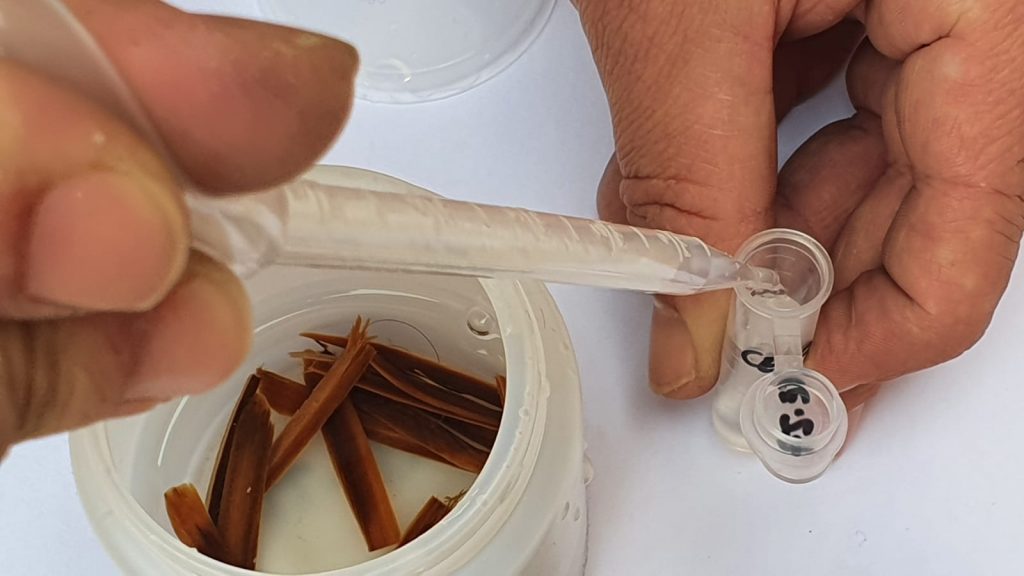
This technique provides information on molecular weight and structure. It is widely used to determine the content of ellagitannins in wine, but it is expensive, slow, and destructive. Prior to measurements in GC-MS, extractions of wood compounds must be prepared. For this purpose, wood chips are immersed in a hydroalcoholic solution for 15 days. With this technique, carried out at the SCSIE unit of the University of Valencia, data were obtained on the content of eugenol, β-methyloctalactone, guaiacol, 4-methyl guaiacol, vanillin, furfural, 5-methylfurfural.
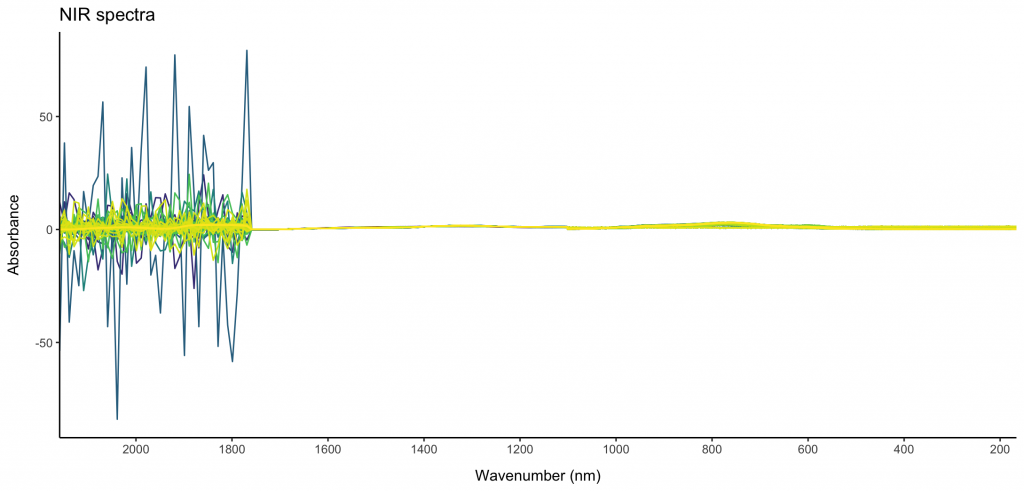
Vis-NIR
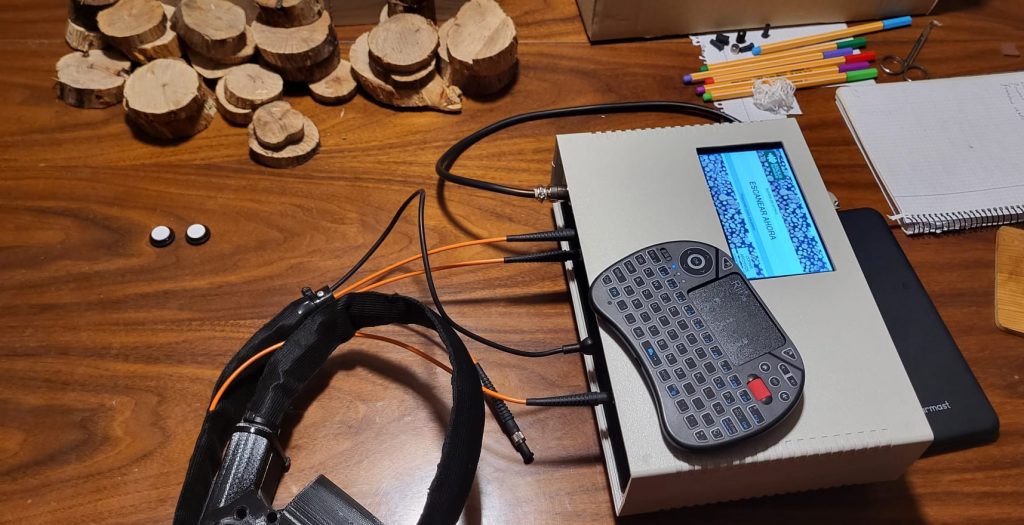
Vis-NIR spectroscopy allows recording the “fingerprint” (physical-chemical) of the wood by analysing the vibrations of the covalent bonds of the sample in the ranges of the visible electromagnetic spectrum (400-780 nm) and near infrared (780-2500 nm). The measurements will be carried out with our own equipment, the SATree-Boscalia portable spectrometer, developed by our company and which has 3 detectors that cover the following wavelength ranges: 300-1,100 nm, 900-1,700 nm and 1,750-2150 nm.
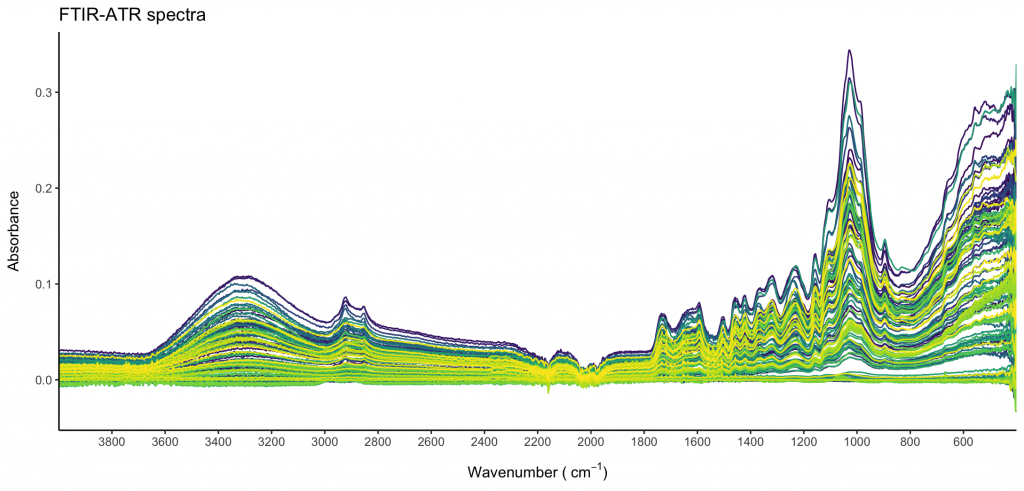
FTIR-ATR
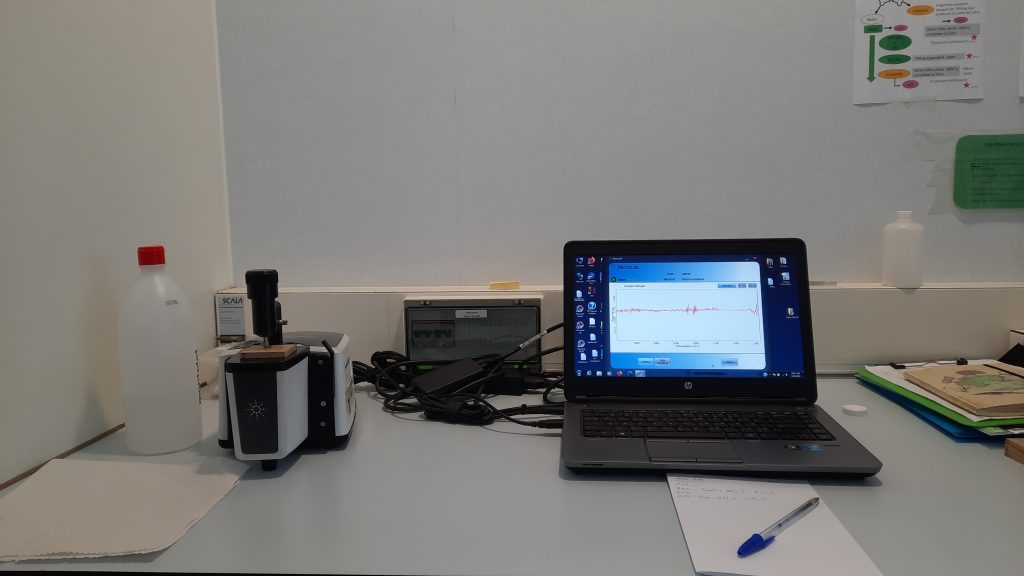
FTIR-ATR spectroscopy, like Vis-NIR, allows for the registration of the “fingerprint” (physicochemical) of wood, but at a different wavelength, so they complement each other. These measurements will be carried out in collaboration with the EcoPast group at the University of Santiago de Compostela.
Statistical processing:
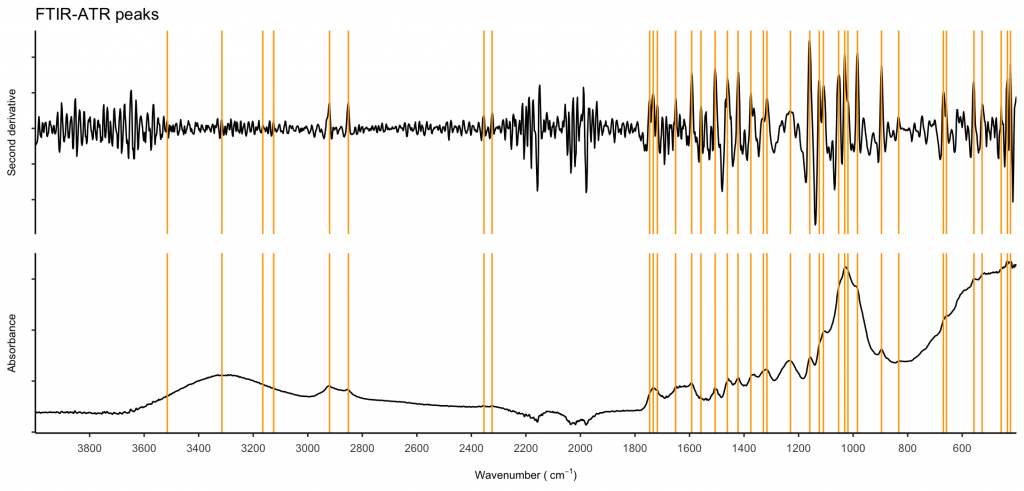
Once the spectroscopy (NIR and MIR) and GC-MS data were obtained, they were processed and statistically analysed. In the case of the NIR data, 3 measurements were made per sample and to combine this information with the GC-MS and FTIR-ATR data in which only one measurement was made per sample, the average NIR spectra were calculated. Additionally, NIR data were considered: (i) as a whole, (ii) between 165 and 1100 nm, (iii) between 1101 and 1700 nm, and (iv) between 165 and 1700 nm. In the case of the FTIR-ATR data, the peaks were identified using the {andurinha} R library following the protocol described by Álvarez Fernández and Martínez Cortizas (2020), using the second derivative option with the standardized data and the peaks. They were selected based on the FTIR-ATR spectroscopy data provided by the online database SpectraBase; with a final selection of 79 peaks. In the case of GC-MS data, some of the compounds of interest are detected in all samples, except in three of them, in which none are detected, and, therefore, they are discarded for the creation of the models.
For the prediction models of the compounds of interest, 9 data sets were used, combining data obtained with spectrophotometry and GC-MS data in different ways: (i) the total NIR data set, (ii) NIR of 165 at 1100, (iii) NIR from 1101 to 1700 nm, (iv) NIR from 165 to 1700 nm, (v) the four previous variables with the 79 FTIR-ATR peaks and (vi) FTIR-ATR without NIR. The algorithms that were tested were: Partial Least Squares Regression (PLS-R), Linear Support Vector Machine (SVM-L) and Random Forest (RF). The division of the data set into training and validation data was done in a 70/30 ratio. The data were previously standardized and centered and the models were trained using the R package {caret}. The statistical method that gave the best results was Random Forest. Contrary to what was expected, the models obtained with NIR were not very good, obtaining a coefficient of determination (r2) < 0.6, this coefficient represents the proportion of the variance of the problem (or dependent) variable that we are able to explain with the model through the independent variables. However, a model with good prediction indicators could be obtained with the FTIR-ATR data. The r2 were 0.62 for 5-methylfurfural, 0.73 for eugenol, 0.87 for furfural, 0.75 for vanillin. With a sensitivity (probability that the species classified as x is really x) of 0.5 for 5-methylfurfural and eugenol, 0.78 for furfural and 0.67 for vanillin. The specificity (probability that the species not classified as x is not x) was 0.75 for 5-methylfurfural, 0.96 for eugenol, 0.97 for furfural, and 0.83 for vanillin.